
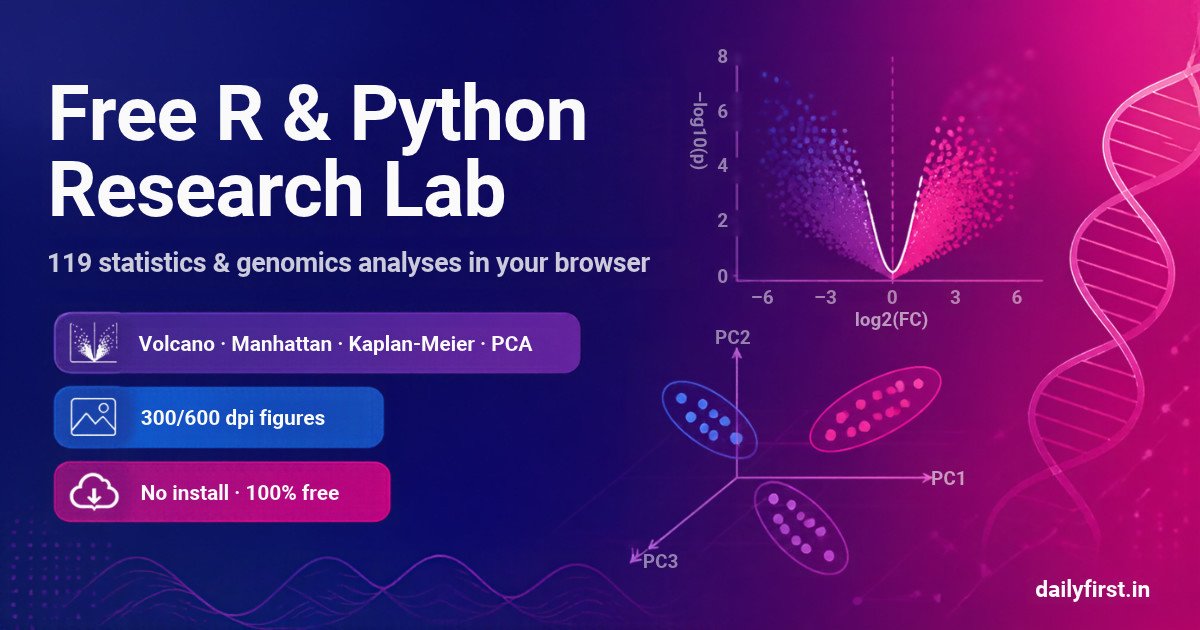
Installing R, RStudio, Python and a dozen packages just to make one figure for a manuscript wastes hours, and lab or university computers often do not allow installs at all. We have built a free alternative for students and researchers: the DailyFirst R & Python Research Lab. It runs real R 4.6 and Python 3.14 inside your web browser, with 119 ready-made analyses and figures you can download at 300 or 600 dpi for journals.
What is the R & Python Research Lab?
It is an online workspace that looks and works like a simple version of RStudio or Jupyter. The difference is that nothing is installed and nothing runs on a server: R and Python are compiled to WebAssembly (through the open-source webR and Pyodide projects) and run on your own computer, inside the browser tab. That has three practical benefits for researchers:
- No installation or sign-up. Open the page and start. It works on Windows, Mac, Linux and Chromebooks, including locked-down institute computers.
- Your data stays private. Your file is analysed on your own device and is never uploaded to our website, which matters for unpublished results and patient data.
- Reproducible, citable code. Every analysis shows the actual R or Python code. Save the script for your supplementary material and rerun it later in RStudio or Jupyter.
How to use it in four steps
- Add your data. Upload a CSV or Excel file, paste cells copied from Excel, or start with the built-in sample dataset. Genomics templates also accept FASTA files.
- Pick an analysis. Choose from 119 templates in R or Python, grouped into categories.
- Set your column names. Change the variable names at the top of the code. Clicking a column name inserts it into the code for you.
- Run and download. Press Run (or Ctrl + Enter), read the statistics, and download each figure as PNG or TIFF at 300 or 600 dpi, or as vector SVG or PDF, at the exact width and height your journal asks for.
The first run downloads the R or Python engine into your browser, which takes about 20 to 60 seconds. After that, analyses run in seconds.
What analyses are included?
Basic statistics and hypothesis tests
Descriptive statistics by group, t-test (Welch, Student, Mann-Whitney, Cohen’s d), one-way and two-way ANOVA with Tukey HSD, Kruskal-Wallis, chi-square and Fisher’s exact test, mosaic plots, histograms with Shapiro-Wilk and Q-Q plots, ANCOVA with adjusted means, and repeated-measures designs (paired t-test, spaghetti plots, mixed ANOVA, dumbbell plots).
Publication graphs
Bar charts with mean ± SE and data points, box and violin plots, split violin, beeswarm, density and ridgeline plots, correlation and regression scatter plots, LOWESS smoothers, scatter plots with marginal histograms, bubble charts, lollipop charts, population pyramids, waterfall plots, radar charts, alluvial (Sankey) diagrams, treemaps, sunburst, waffle, rose and donut charts, and 3D scatter and density surfaces.
Clinical and epidemiological research
Kaplan-Meier curves with log-rank test, Cox regression and hazard ratio forest plots, competing-risks cumulative incidence, ROC curves with AUC and the best cut-off, sample size for ROC studies, diagnostic accuracy from a 2×2 table (sensitivity, specificity, PPV, NPV with 95% CI), Bland-Altman agreement, intraclass correlation (ICC), logistic and Poisson regression, calibration plots with the Hosmer-Lemeshow test, and meta-analysis forest plots with fixed and random effects and I².
Multivariate analysis and machine learning
PCA biplots, factor analysis, k-means (with elbow and silhouette), PAM and CLARA clustering, hierarchical clustering with dendrograms, clustergrams, heatmaps, correlograms, scatter plot matrices, parallel coordinate plots, linear discriminant analysis, decision trees, random forests with feature importance, multicollinearity (VIF) checks and mediation analysis with a path diagram.
Genomics and bioinformatics
- RNA-seq: volcano and MA plots from DESeq2, edgeR or limma results; differential expression from a count matrix; heatmaps of top variable genes; sample PCA; library-size and correlation QC.
- GWAS: Manhattan plots with genome-wide significance lines and QQ plots with the genomic inflation factor (λGC).
- Gene sets: GO/KEGG enrichment dot plots, UpSet plots for comparing gene lists, and hypergeometric over-representation tests.
- DNA sequences: FASTA statistics, GC content with sliding windows, and a six-frame ORF finder with translation.
Each genomics template loads a matching sample dataset, so you can see the expected format before uploading your own file. For the final statistics of an RNA-seq paper, we recommend confirming differential expression with DESeq2, edgeR or limma in RStudio; the browser version uses a simplified method that is ideal for exploration and figures.
Making journal-ready figures
Most journals ask for figures at 300 dpi (photos and colour figures) or 600 dpi (line art), usually 3.5 inches wide for a single column or 7 inches for a double column, often as TIFF. In the lab, choose the format and size in the “Download figures” bar after running an analysis. The templates already use a clean publication theme and a colour-blind friendly palette, so most figures are ready to submit without editing.
How to cite the software in your paper
Cite the language and packages you used rather than this website. A typical Methods sentence is: “Statistical analyses were performed in R version 4.6.0 (R Core Team, 2026) using the ggplot2 and survival packages.” Run citation() or citation("ggplot2") in the R tab to get exact references.
Frequently asked questions
Is it really free?
Yes. There is no sign-up, no limit on analyses and no watermark on figures.
Can I write my own R or Python code?
Yes. Every template is editable, and blank R and Python scripts are included. In R you can install most CRAN packages with need("packagename"); in Python, NumPy, pandas, SciPy, matplotlib, statsmodels and scikit-learn are available.
Does it work on a phone?
It works in recent versions of Chrome, Safari, Edge and Firefox, including on phones and tablets, but a laptop or desktop is more comfortable for real datasets.
More free tools for researchers
The lab sits alongside our other free tools: the UGC API score calculator, h-index calculator, journal quality checklist, patent draft builder and quick calculators for the t-test and ANOVA. See them all on the Analytical Tools page.
Try the R & Python Research Lab with your next dataset, and tell us in the comments which analysis or genomics tool you would like us to add next.
Discover more from dailyfirst
Subscribe to get the latest posts sent to your email.